|
This video says it matches "Lesson 11-3 in your red Holt textbook". We no longer use that textbook, but this is still a great introduction to our next math topic, Coordinate Graphing. Enjoy! After you are finished watching the video, please complete the short "quiz" at this link (click here). This "quiz" is how I will know you watched the video; there is not another video response mentioned in the video today. We're mixing things up. :) Good luck! The questions we have done in class for Lessons 1-5 are available at this link (click here) as PowerPoint slides.
Lesson 5 Packet Problem Set Answers:
If there is anything I can do to help you prepare for tomorrow's quiz, please let me know! You may ask questions in the comments section below, or click here to send me a (more private) message. If it was not finished in class today, the following four problems (with their bar models!) are homework this weekend.  Hello Green Team Math Friends, A few quick reminders about your homework for tonight... You are to look at the data in the chart below (collected in class today) and choose one question to represent in a graph. So your graph might be about how many bowls of cereal the students in your math class eat during an average week. OR it might be about the ages of the students in your math group. You would not do use data from both of these questions. After you have chosen the topic for your graph, make the best graph that you can to represent the data. We will be analyzing (comparing and contrasting) these graphs tomorrow in class, and awarding candy prizes for the graph that is the most well done (effort), for the graph that is the most creative, and for the graph that is the most mathematical. Be sure to think through things that teachers in years past (science and math?) have told you need to be part of all graphs. For example, all graphs should have a title. Good luck! If you have any questions, please use this link (click here) to send me a message. 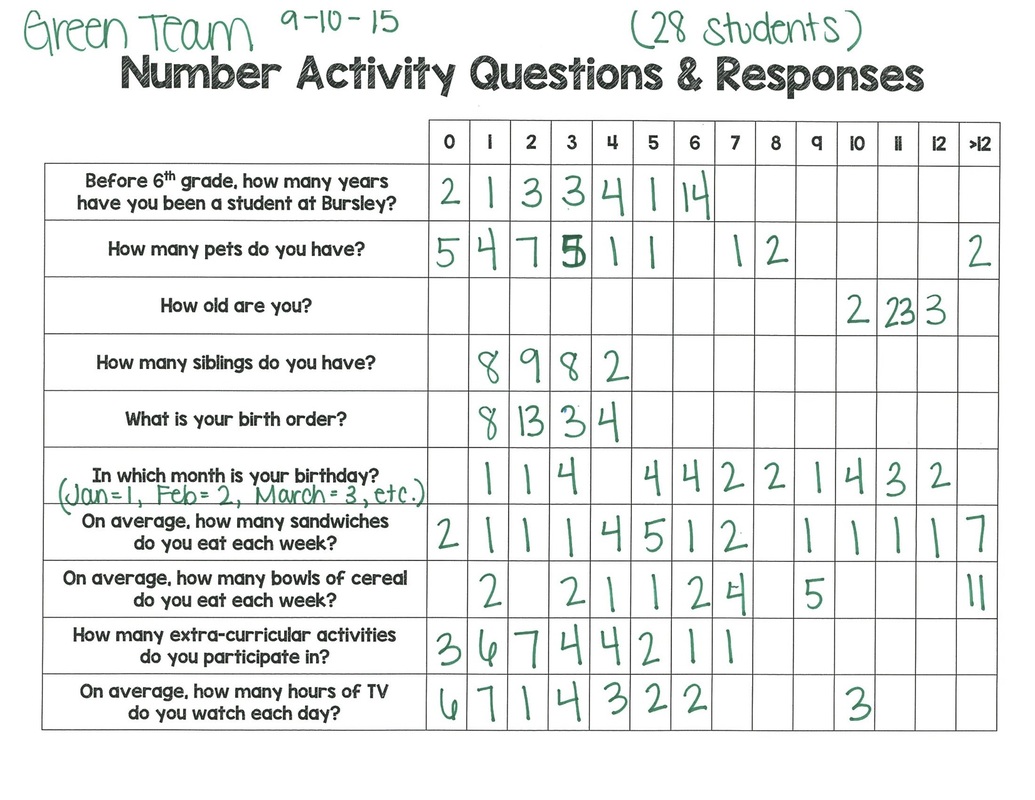 |