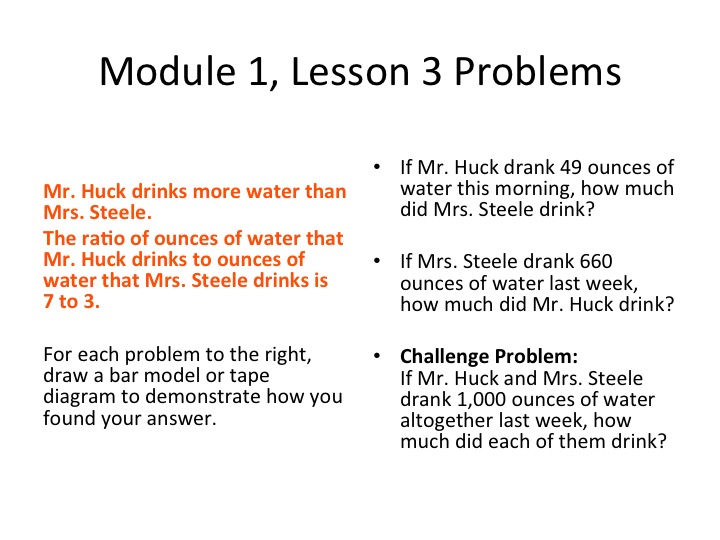
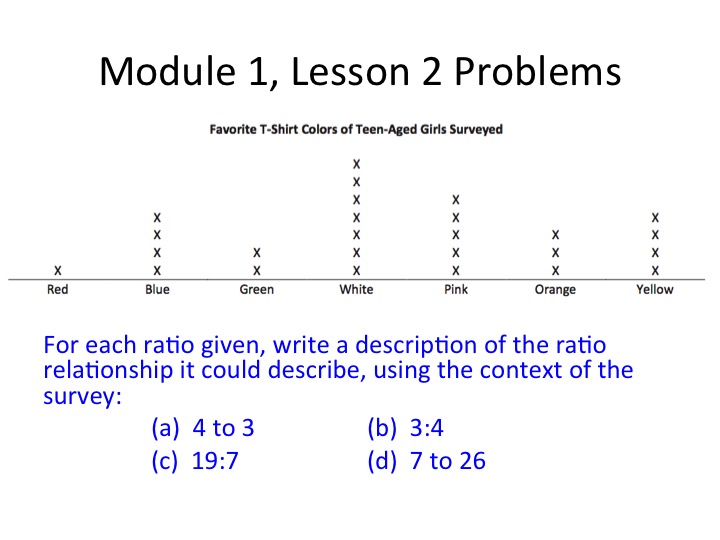
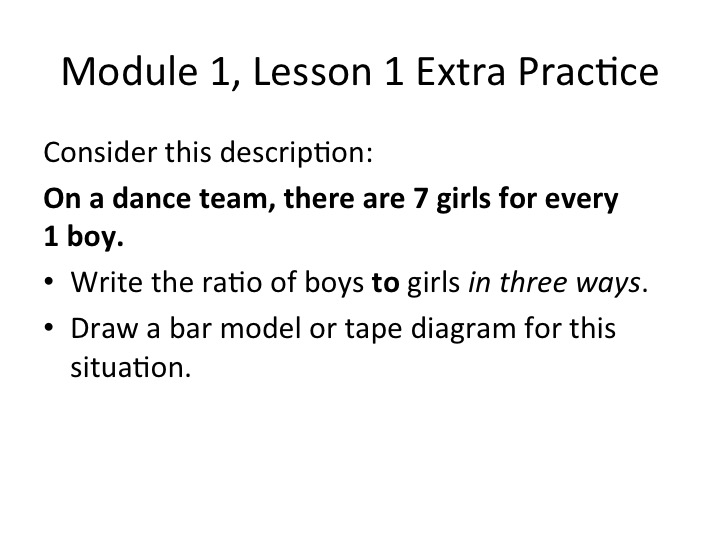
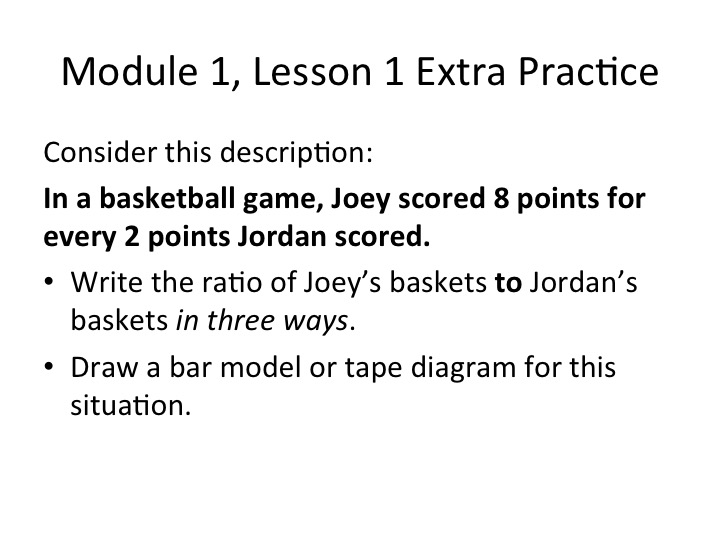
|
As you review for Monday's quiz, you might find the questions at this link (click here) helpful.
If you have any questions for Mrs. Steele, please click here to send me a message or post your questions publicly in the comments section below. I will do my very best to get back to you ASAP! :) Reminder: The front side of today's Equivalent Ratios worksheet (titled "Module 1, Lesson 4 Supplemental Practice") is due tomorrow. The image below should help you complete those problems. Please do not go on to the problems on the back until we have gone over the front ones together, as I want to make sure you're on the right track before you do a bunch of problems. Good luck! :) 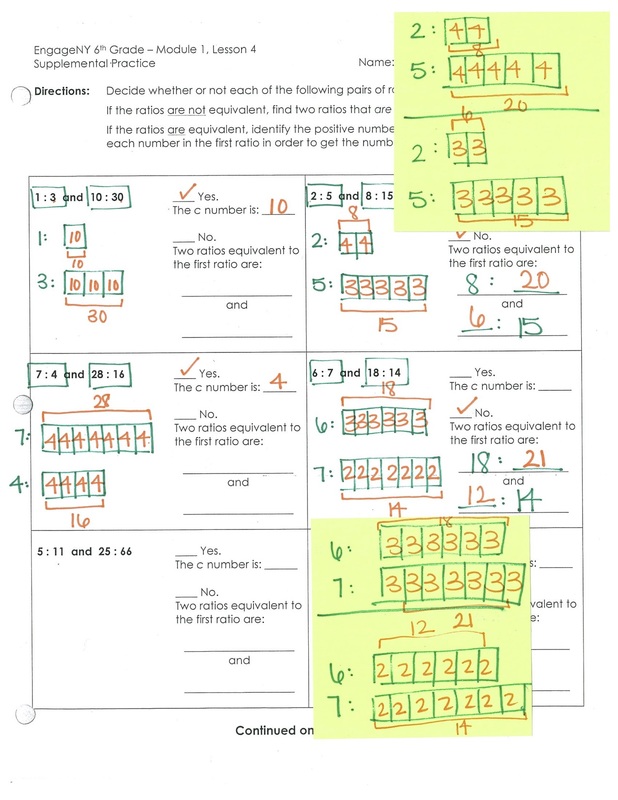 Hello White Team Math Friends, A few quick reminders about your homework for tonight... You are to look at the data in the chart below (collected in class today) and choose one question to represent in a graph. So your graph might be about how many bowls of cereal the students in your math class eat during an average week. OR it might be about the ages of the students in your math group. You would not do use data from both of these questions. After you have chosen the topic for your graph, make the best graph that you can to represent the data. We will be analyzing (comparing and contrasting) these graphs tomorrow in class, and awarding candy prizes for the graph that is the most well done (effort), for the graph that is the most creative, and for the graph that is the most mathematical. Be sure to think through things that teachers in years past (science and math?) have told you need to be part of all graphs. For example, all graphs should have a title. Good luck! If you have any questions, please use this link (click here) to send me a message. 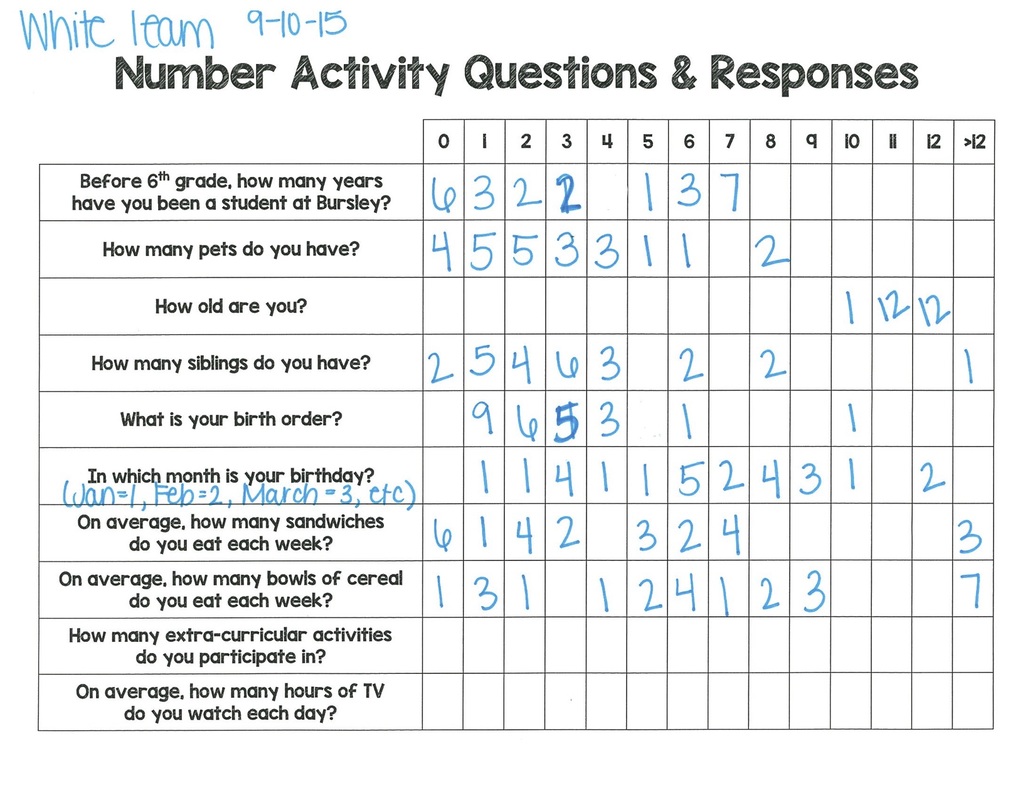 |